Chapter 3 Selection of Trajectory Features
An expression matrix from an high-throughput experiment contains hundreds of features that bear no or little information about a sample’s progress through the trajectory of interest. These non-relevant features not only increase the computational runtime of the trajectory reconstruction, but they also impair the accuracy of downstream analysis results. CellTrails assumes that key features show high expression variability during a sample’s progression along the biological process under study. Therefore, CellTrails enables to unbiasedly filter the informative features.
Please note that the following functions only indicates features used for dimensionality reduction, state detection and trajectory reconstruction; it does not remove features from the assay stored in the SingleCellExperiment object. Thus, all features are still available for CellTrails donwstream analyses capabilities, such as cluster analysis and inference of expression dynamics, as well as, for functions available from complementary analysis packages.
The names of trajectory features can be received from and set to a SingleCellExperiment object using the function trajFeatureNames. The showTrajInfo function, as well, provides an overview of the selected trajectory features.
Please note that the following filter functions can be used incrementally, since statistical characteristics are only analyzed for already designated trajectory features. In other words, using the filters multiple times or combining the filters will result in a more stringent selection of trajectory features. Initially, all features in a SingleCellExperiment (excluding spike-in controls), are assumed to be trajectory features.
3.1 Filter by Detection Level
This filter determines trajectory features that are present in a disproportionate small number of samples. It removes features that are not expressed or that do not sufficiently reach the technological limit of detection. The detection level is defined as the fraction of samples in which a feature is detected, i.e., the relative number of samples having a feature’s expression value greater than 0. If a threshold >= 1 is selected, its value is automatically converted to a relative fraction of the total sample count. The empirical cumulative distribution function of all samples and the fraction of removed features is shown.
# Filter features expressed in at least 3 samples
tfeat <- filterTrajFeaturesByDL(exSim, threshold=2)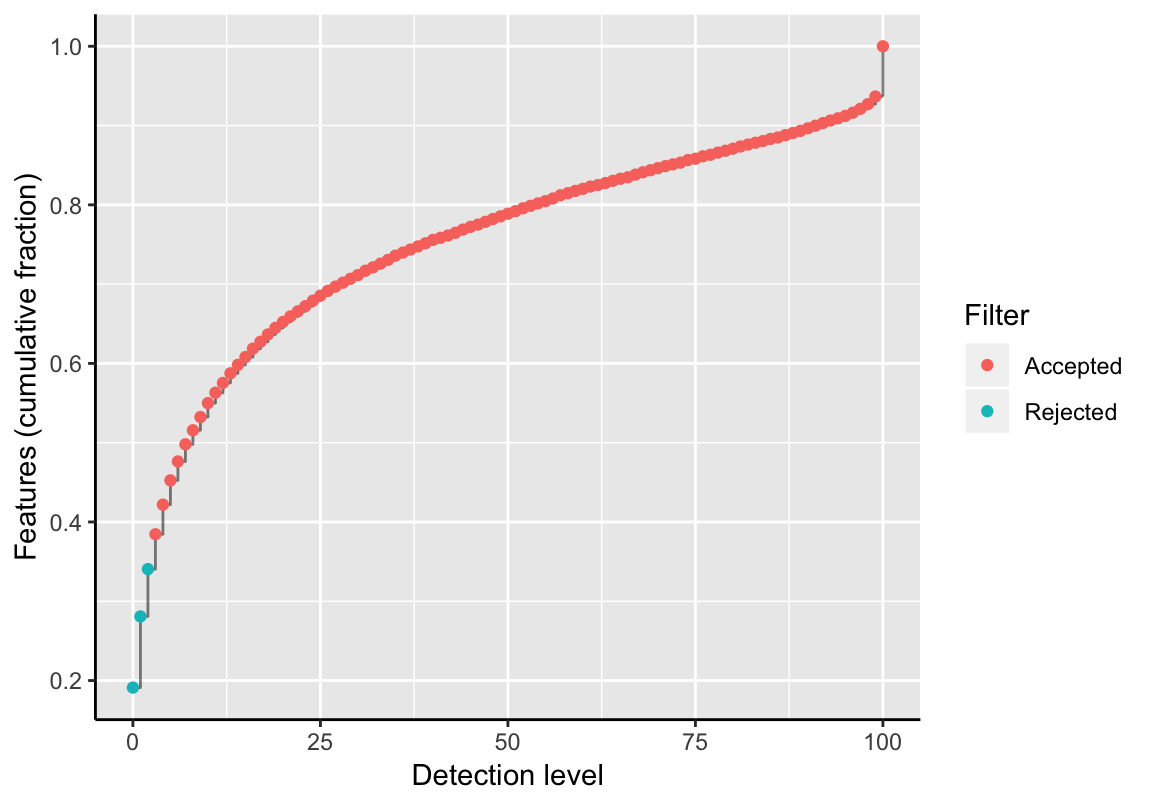
tfeat[1:5]## [1] "feature_84" "feature_88" "feature_92" "feature_94" "feature_96"# Setting trajectory features to the object
trajFeatureNames(exSim) <- tfeat
showTrajInfo(exSim)## [[ CellTrails ]]
## logcounts: 15000 features, 100 samples
## Pheno data:
## sampleNames: "sample_1" "sample_2" ... "sample_100" (100)
## phenoNames: none
## Feature data:
## featureNames: "feature_1" "feature_2" ... "feature_15000" (15000)
## rowData: none
## Trajectory data:
## trajFeatureNames: "feature_84" "feature_88" ... "feature_15000" (9839)
## latentSpace: none
## states: none
## Trajectories: none
## trajSampleNames: "sample_1" "sample_2" ... "sample_100" (100)
## trajResiduals: MSE=NA
## landmarks: none
## trajLayout: none
## Trail data:
## trailNames: none3.2 Filter by Coefficient of Variation
This filter determines trajectory features with a narrow standard deviation (sd) with respect to its average expression (mean). This filter removes features with high expression and low variance, such as housekeeping genes. The coefficient of variation is computed by CoV(x) = sd(x)/mean(x). Features with a CoV(x) greater than a given threshold remain labeled as trajectory feature in the SingleCellExperiment object. The empirical cumulative distribution function of all samples and the fraction of removed features is shown.
# Filter features with COV > 0.5
tfeat <- filterTrajFeaturesByCOV(exSim, threshold=0.5)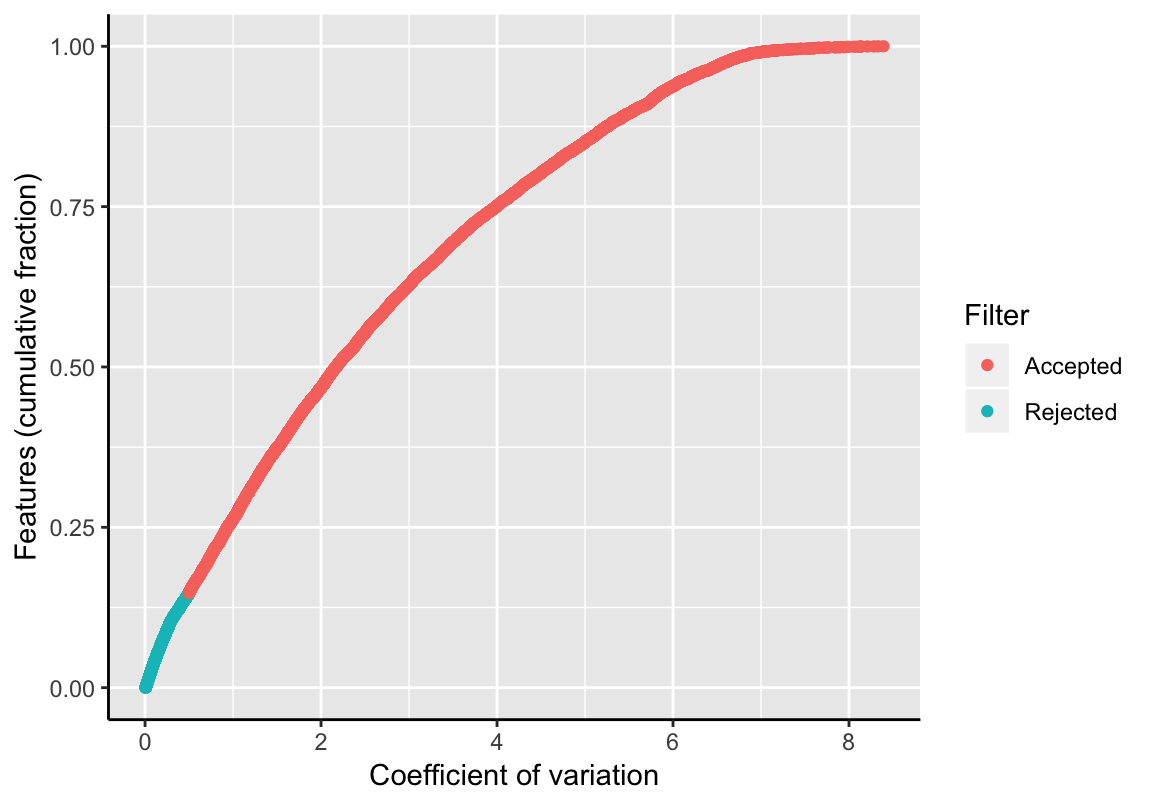
# Setting trajectory features to the object
trajFeatureNames(exSim) <- tfeat
showTrajInfo(exSim)
## [[ CellTrails ]]
## logcounts: 15000 features, 100 samples
## Pheno data:
## sampleNames: "sample_1" "sample_2" ... "sample_100" (100)
## phenoNames: none
## Feature data:
## featureNames: "feature_1" "feature_2" ... "feature_15000" (15000)
## rowData: none
## Trajectory data:
## trajFeatureNames: "feature_84" "feature_88" ... "feature_14998" (8386)
## latentSpace: none
## states: none
## Trajectories: none
## trajSampleNames: "sample_1" "sample_2" ... "sample_100" (100)
## trajResiduals: MSE=NA
## landmarks: none
## trajLayout: none
## Trail data:
## trailNames: none3.3 Filter by Fano Factor
This filter identifies the most variable features while considering their average expression level. Features are placed into 20 bins based on their mean expression. For each bin, the distribution of Fano factors, which is a windowed version of the index of dispersion (IOD = variance / mean), is computed and standardized (Z-score(x) = x/sd(x) - mean(x)/sd(x)). Highly variable features with a Z-score greater than a given threshold remain labeled as trajectory feature in the SingleCellExperiment object. The parameter min_expr defines the minimum average expression level of a feature to be considered for this filter (default: 0). The Fano factor and the average expression is shown for each feature; filtered features are highlighted.
# Filter features with Z > 1.7
tfeat <- filterTrajFeaturesByFF(exSim, threshold=1.7)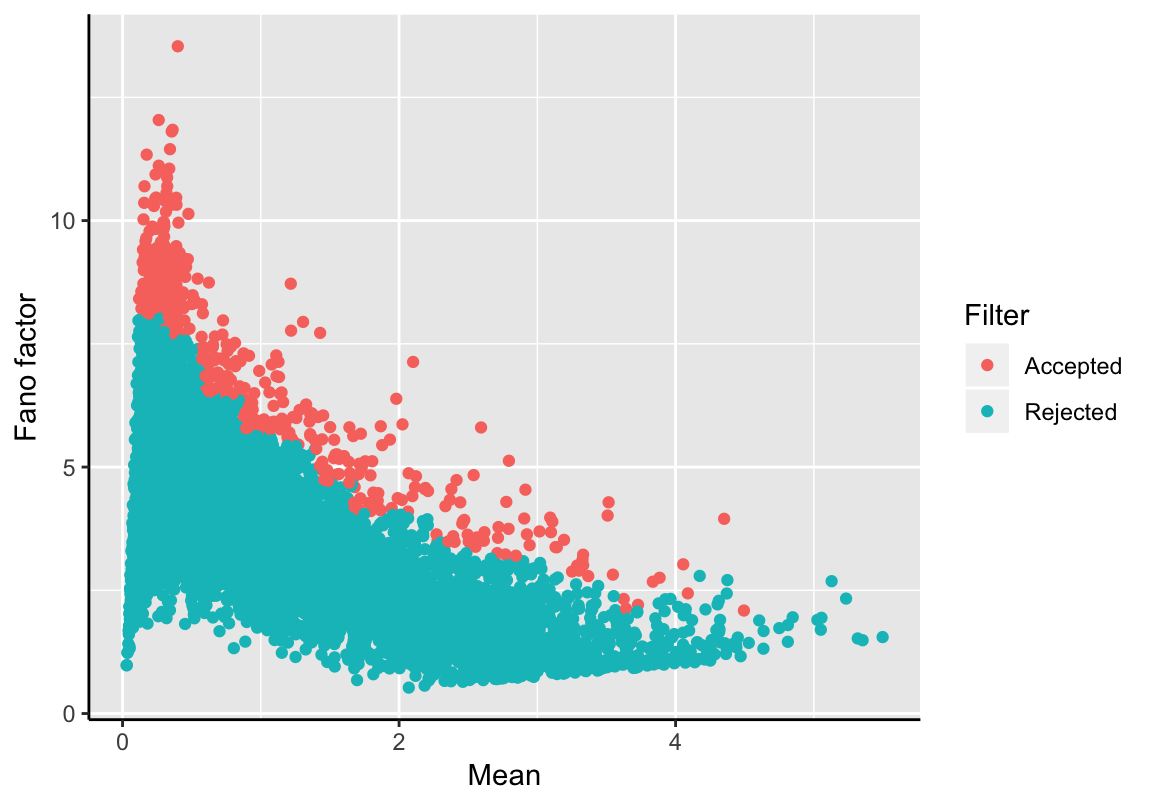
# Setting trajectory features to the object
trajFeatureNames(exSim) <- tfeat
showTrajInfo(exSim)
## [[ CellTrails ]]
## logcounts: 15000 features, 100 samples
## Pheno data:
## sampleNames: "sample_1" "sample_2" ... "sample_100" (100)
## phenoNames: none
## Feature data:
## featureNames: "feature_1" "feature_2" ... "feature_15000" (15000)
## rowData: none
## Trajectory data:
## trajFeatureNames: "feature_118" "feature_183" ... "feature_14998" (485)
## latentSpace: none
## states: none
## Trajectories: none
## trajSampleNames: "sample_1" "sample_2" ... "sample_100" (100)
## trajResiduals: MSE=NA
## landmarks: none
## trajLayout: none
## Trail data:
## trailNames: none3.4 Blocking Uniformative Substructures
The functions filterTrajFeaturesByCOV and filterTrajFeaturesByFF allow to define a design matrix to account for systematic bias in the expression data (e.g., batch, gender or cell cycle). It should list the nuisance factors that should be blocked and their values per sample. It is suggested to construct the design matrix with the model.matrix function. An example illustrating how to create a proper design matrix is given here.
3.5 Using Alternative Methods
The function trajFeatureNames allows to designate any set of features as trajectory features. The only requirement is that the names in the set match the stored feature names in the SingleCellExperiment object (check with function featureNames). For example, one could also use an abundance-dependent variance trend fit, as implemented in the scran package (Lun, McCarthy, and Marioni 2016), to indicate trajectory features, as shown below. Please note that the (Bioconductor) package scran is not part of CellTrails and may be needed to be installed first.
## Not run:
##library(scran)
## End(Not run)
# Filter using scran
var_fit <- scran::trendVar(x=exSim, use.spikes=FALSE)
var_out <- scran::decomposeVar(x=exSim, fit=var_fit)
tfeat <- featureNames(exSim)[which(var_out$FDR < 0.01)]
# Setting trajectory features to the object
trajFeatureNames(exSim) <- tfeat
showTrajInfo(exSim)
## [[ CellTrails ]]
## logcounts: 15000 features, 100 samples
## Pheno data:
## sampleNames: "sample_1" "sample_2" ... "sample_100" (100)
## phenoNames: none
## Feature data:
## featureNames: "feature_1" "feature_2" ... "feature_15000" (15000)
## rowData: none
## Trajectory data:
## trajFeatureNames: "feature_118" "feature_183" ... "feature_14987" (1058)
## latentSpace: none
## states: none
## Trajectories: none
## trajSampleNames: "sample_1" "sample_2" ... "sample_100" (100)
## trajResiduals: MSE=NA
## landmarks: none
## trajLayout: none
## Trail data:
## trailNames: nonePlease note that filters from different packages can also be combined by subsetting the SingleCellExperiment object with the trajectory features.
# Reset: all features are trajectory features
trajFeatureNames(exSim) <- featureNames(exSim)

# Use CellTrails filter
trajFeatureNames(exSim) <- filterTrajFeaturesByDL(exSim, threshold=2,
                                                  show_plot=FALSE)
trajFeatureNames(exSim) <- filterTrajFeaturesByCOV(exSim, threshold=0.5,
                                                   show_plot=FALSE)

exSim_sub <- exSim[trajFeatureNames(exSim), ]

# Filter using scran
var_fit <- scran::trendVar(x=exSim_sub, use.spikes=FALSE)
var_out <- scran::decomposeVar(x=exSim_sub, fit=var_fit)
tfeat <- featureNames(exSim_sub)[which(var_out$FDR < 0.01)]

# Setting trajectory features to the object
trajFeatureNames(exSim) <- tfeat
showTrajInfo(exSim)
## [[ CellTrails ]]
## logcounts: 15000 features, 100 samples
## Pheno data:
## sampleNames: "sample_1" "sample_2" ... "sample_100" (100)
## phenoNames: none
## Feature data:
## featureNames: "feature_1" "feature_2" ... "feature_15000" (15000)
## rowData: none
## Trajectory data:
## trajFeatureNames: "feature_118" "feature_183" ... "feature_14987" (466)
## latentSpace: none
## states: none
## Trajectories: none
## trajSampleNames: "sample_1" "sample_2" ... "sample_100" (100)
## trajResiduals: MSE=NA
## landmarks: none
## trajLayout: none
## Trail data:
## trailNames: noneReferences
Lun, ATL, DJ McCarthy, and JC Marioni. 2016. “A Step-by-Step Workflow for Low-Level Analysis of Single-Cell Rna-Seq Data with Bioconductor.” F1000Res. 5: 2122.